Independent Research
The following page contains information that might not be up to date with the most current research in the bioinformatics field. It’s intended as a record of my story, not a valid scientific source of any kind. Feel free to contact me with any questions.
In my final year of high school, I had the incredible opportunity to work in TJHSST’s biotechnology lab. The lab gave me access to thousands of dollars of cutting-edge equipment and research projects involving everything from gene editing using CRISPR to recellularization of plant structures with animal cells to DNA sequencing of microbial biofilms growing on stone monuments around Washington, DC. That last project ended up being the one I chose to focus on over my senior year.
Microbial Biofilms and DNA Sequencing
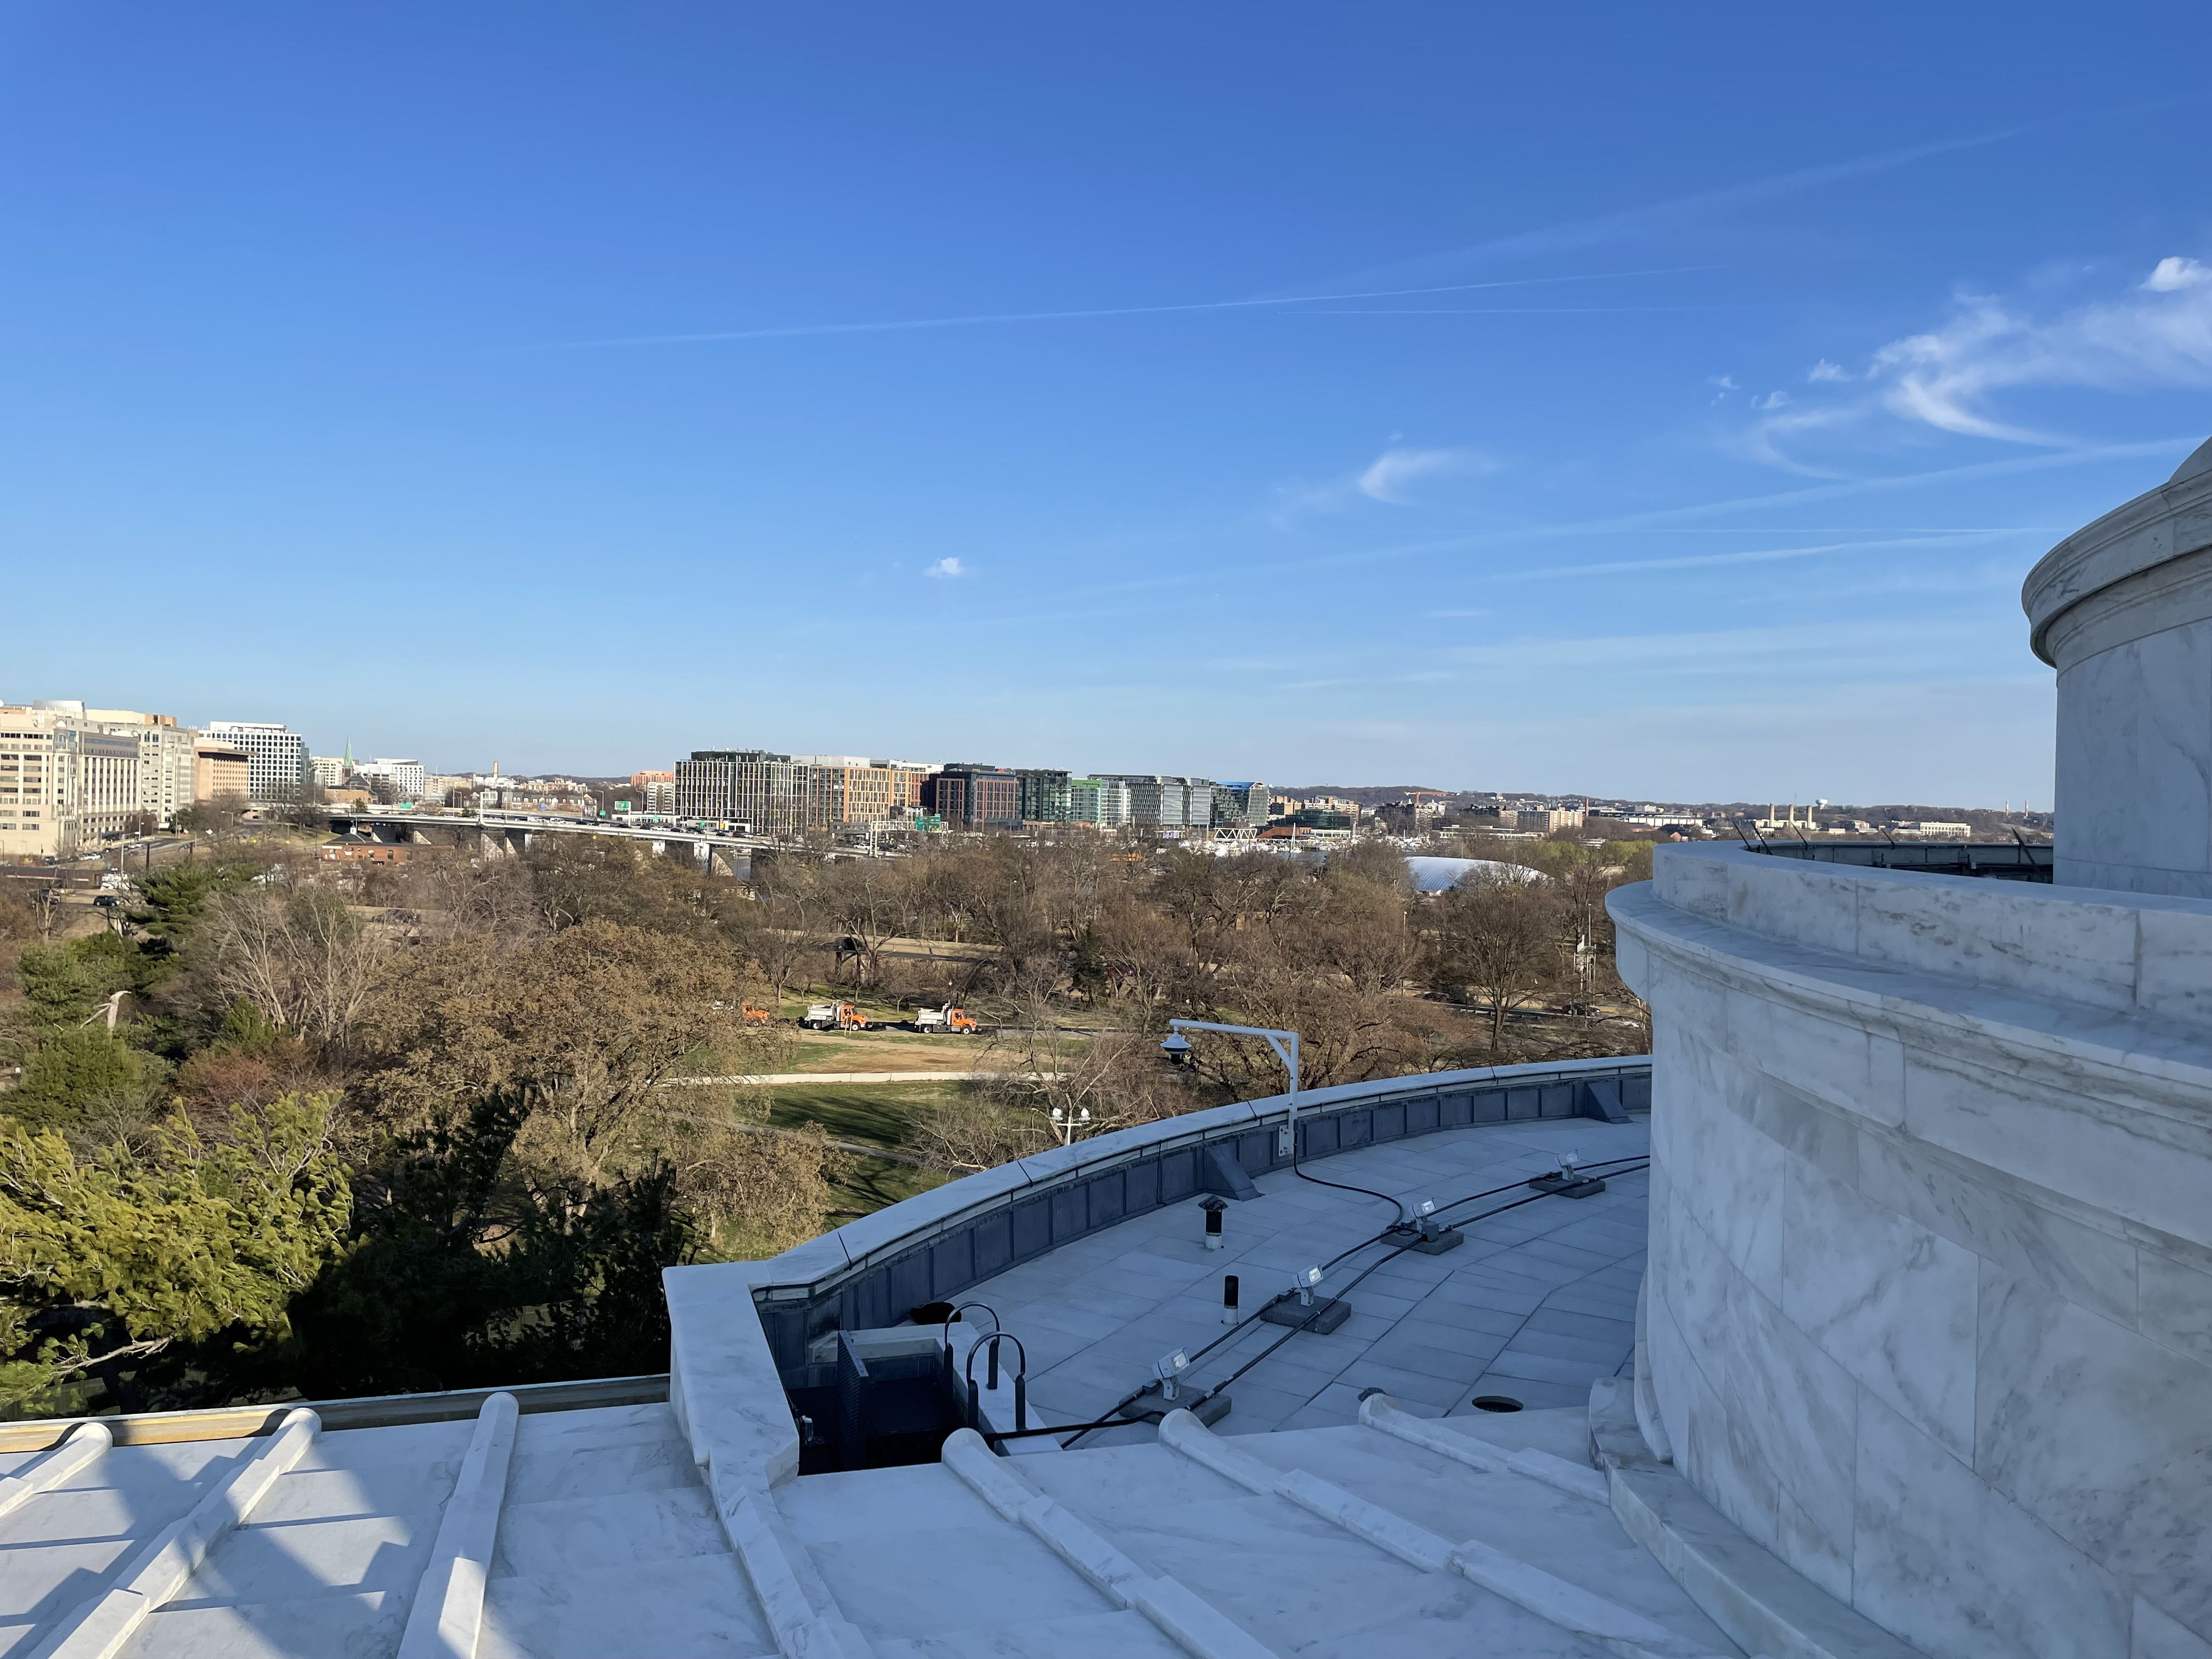 The roof of the Jefferson Memorial in Washington, DC, where I went to scrape off samples of biofilm from the marble surface.
At the start of the school year, I worked with two other students on a team to continue an ongoing research project that our school had been involved with: investigating the biofilms growing on stone surfaces at Arlington National Cemetery and the Jefferson Memorial. Students had been visiting these monuments for years and collecting samples of an ugly green film for DNA sequencing and analysis back at our lab, in the hopes of providing the National Park Service with useful information about what bacteria were living on the stone, what might’ve been the source of the green pigmentation, and what potential avenues for treatment might be. In continuing this project after the COVID-19 pandemic, we returned to our sampling sites and collected the next data points in a long-term project.
Sequencing DNA turned out to be much easier said than done (though should that really have come as a surprise?). Collecting samples of marble surfaces with a scalpel in frigid, windy weather was difficult enough on its own, but when it came to actually preparing those samples for sequencing, we had to do a huge amount of precise and tedious pipetting. The other two members of my group were perfectly content with this, but my passion isn’t and never was for moving reagents from one test tube to another. I’m an analyst at heart, so my work naturally started to diverge from sequencing DNA to analyzing our results.
Diverging to Data
Data analysis was never a high priority for previous groups of students doing sequencing work on DC’s stone monuments (apparently it’s somehow “uninteresting”??); they focused on collecting samples and putting them through our Ion Torrent sequencing machine. Most students hardly looked at the actual results of our sequencing runs, instead opting to send them through ThermoFisher’s proprietary Ion Reporter analysis pipeline. This pipeline was very cleanly integrated into the Ion Torrent machine, making data analysis easy and fast.
But I wasn’t content with just sending our data through a black box pipeline to generate the same kind of results that people had been generating for years. That’s no fun at all. Instead, I downloaded a huge amount of data from previous years and used it as a playground, trying to see what kinds of analyses I could do and what kinds of questions I could answer. I tried QIIME2, multiple sequence alignment, phylogenetic tree generation, taxonomic classification, and countless other conventional analysis strategies that produced insightful results.
In that process, I noticed something missing from many of these conventional techniques: the representation of microbial life as a true continuum. At the macro-scale, it’s very easy for us to classify a plant or animal as part of a new species: can it interbreed with plants or animals of another existing species? If so, not a species. If not, congrats! You just discovered a new species! But at the microbial level, it’s far less simple (and there are even unusual cases in the macro-scale where a species can get hard to define). Most bacteria don’t reproduce sexually, tossing the reproductive definition of a species out the window. The prevailing definition involves comparing genetic similarity between a potential new species and other known near relatives. However, this runs into significant issues when we factor in forces like horizontal gene transfer, the transfer of genetic material between bacteria often across species. The end result is that bacteria exist on a genetic continuum. The “tree” of life isn’t really a tree; it’s more of a spatial map.
So I found it very disappointing that I was unable to find any tools or methods that could effectively represent this fundamental reality of the microbial world. Ion Reporter attempted to classify all bacteria on this continuum into taxonomic boxes, and visualizing those boxes did provide valuable insight into our results, but it relied on a false assumption that bacteria can be classified into a taxonomic system at all. Other methods which looked at the frequencies of independent unique sequences (known as ASVs) only helped to compare different samples, not different sequences as I’d hoped. So I decided to diverge fully from my original project and develop this analysis method myself. My central question was this: Was it possible to convert individual DNA sequences into points in a multidimensional space such that when plotted together, more similar sequences would be closer together and more different sequences would be farther apart? In other words, could sequential DNA base pair data be converted into simple multidimensional points that retained the information of the original data? That second question hints at the approach I would take to solve this problem: machine learning.
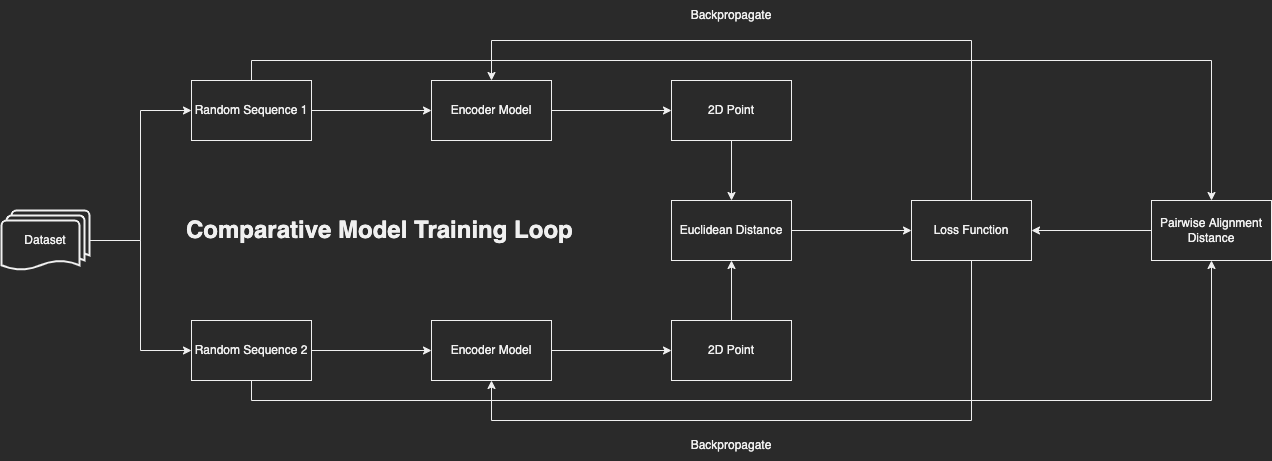 A flowchart of my comparative model’s training loop.
Over my final few months of high school, I created a neural network capable of taking a 300-base-pair excerpt of 16S rRNA and converting it into a 2D point that best represented where in space that sequence fell in relation to the other sequences that the model was trained on. The model was trained comparatively: two random sequences were passed through the model and the Euclidean distance between the resultant points was compared to the sequences’ true dissimilarity (as computed by pairwise sequence alignment). The model was then trained to make the Euclidean distances match true dissimilarity as closely as possible. Because I was using random pairs of sequences to train my model instead of individual sequences, I had a virtually infinite number of possible pairs and overtraining wasn’t a significant issue.
The model itself was implemented in TensorFlow and took advantage of a rising star in natural language processing: the transformer. Ever since Google’s revolutionary publication Attention is All You Need, the transformer architecture has been changing the landscape of machine learning by adding attention to neural networks. The attentional component is essentially a dot product that allows the model to gain an understanding of context. In NLP, it allows the model to learn the relationships between words and understand how something at the beginning of a sentence can affect the end. I had the idea to use the same process on DNA sequences so that the model could learn relationships between distant base pairs. I combined this with a more conventional convolutional neural network to create a highly performant model. I trained this model on SILVA, a large public dataset of 16S rRNA sequences that served as a controlled environment with accurate labels. By plotting the 2D points that the model outputs as a scatterplot and coloring them by their known taxonomic classification, I was able to produce images with breathtakingly high fidelity that effectively represented the continuum of life. Once I was accepted to UT Austin, I got in contact with faculty and got myself compute hours on the world’s largest university supercomputer to scale up my model and further increase the plots’ resolution.
The Results
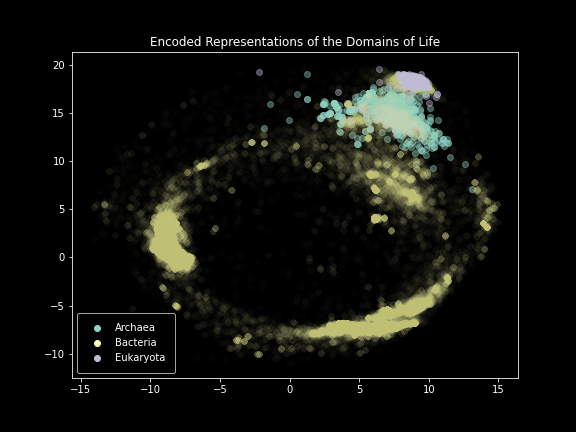 Domain-level plot of SILVA.
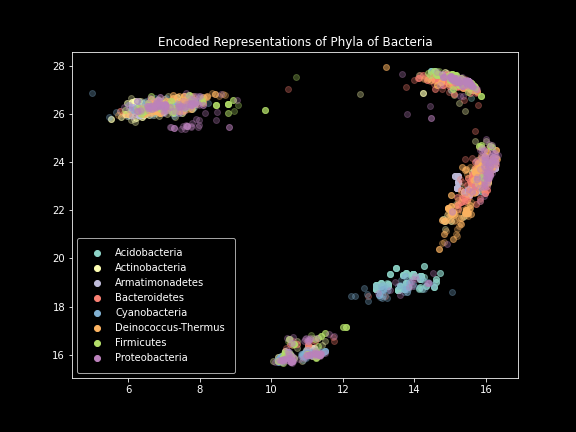
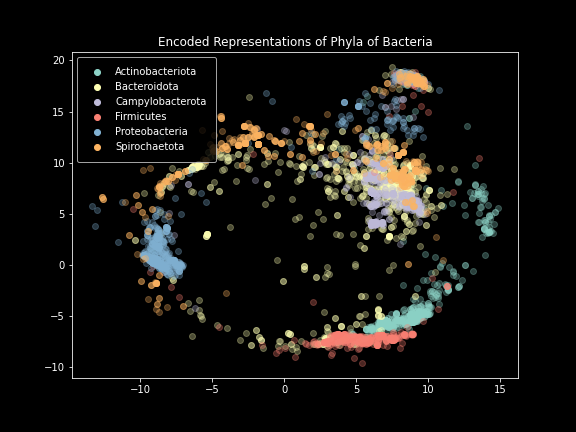 Phylum-level plot.
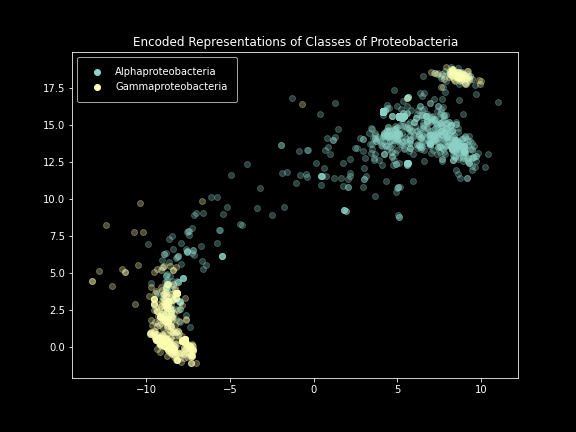 Class-level plot.
These results were incredibly exciting to see after months of failure. The model performed exactly as intended, creating images that effectively represented the SILVA dataset. Clear separation was visible at not only the domain level, but also the phylum and class levels. Unfortunately, things started to break down below that.
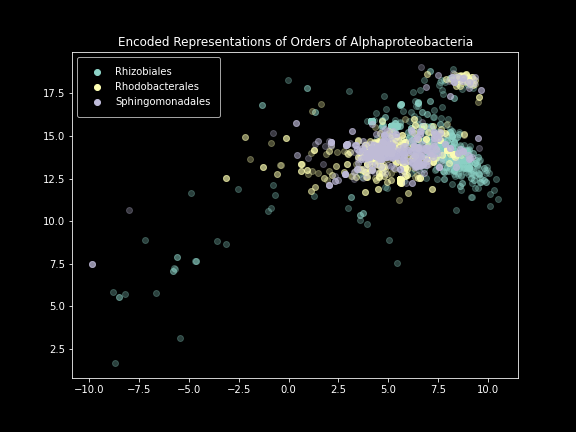 Order-level plot.
This is because two dimensions just doesn’t offer the model enough space to effectively represent all the differences it sees. Scaling it up to three produces much better results at these lower taxonomic levels.
Order-level plot in 3D.
If we remove the goal of visualization, it’s theoretically possible to continue this process even further, increasing the number of dimensions to create a better representation of the dataset. Doing so opens up potential applications in taxonomic classification, sample-sample comparison, and unsupervised clustering approaches that might suggest alternatives to our current taxonomic system.
Applications to Arlington National Cemetery’s Biofilms
While these plots are certainly very pretty (I really can’t overstate how good they look), are there any real-world applications of this technique? It turns out that there are. In any kind of data analysis, it’s very important to do an initial exploratory analysis before diving into specifics. Exploring data can guide more specific downstream techniques with more statistical validity. When looking at a dataset of prices of various stocks over time, for example, the first step would be to look at the raw table and identify any potential points of interest. Does there seem to be a price bubble? Is there a crash in an entire financial sector? Are there any outliers that warrant further investigation? Does anything about this data smell fishy, like there might be some error with the way it was collected? But with DNA sequences, this process of data exploration is incredibly difficult. DNA is very unintuitive by nature, and an analyst can’t easily compare one sequence to another at a glance. By using my model to convert DNA into numbers and visualizing those numbers, the analyst much more easily see what the data “looks like”, and from there can identify any potential avenues for further investigation. To prove this point, I decided to apply my new technique on DNA sequencing data from the ongoing biofilm project at my school.
I wouldn’t be able to get my hands on the data that the others in my group were collecting until the very end of the year; what I did have was data collected in 2019 from Arlington National Cemetery’s amphitheater. The raw output from the Ion Torrent machine was millions of sequences (known as reads) from many samples which came from various regions of the amphitheater and had various surface pigmentation. This output was not quality-checked or trimmed, and there were many duplicates (as can be expected in any sample taken from the environment). The previous group of students had already passed this data through the integrated Ion Reporter analysis software, and this software outputted a list of taxonomically classified unique reads that had been trimmed and quality-checked, along with their respective frequencies in each sample. These results were intended for producing plots showing the proportions of various taxonomic groups in the overall dataset, which can be helpful for determining the composition of a sample. Instead of doing the entire DNA sequence preparation process myself, I elected to piggyback off this output in creating a dataset for my model. I then retrained my model with the new data and attempted to generate similar plots to the plots I created for the SILVA database.
 Arlington National Cemetery’s biofilms, colored by bacterial phylum. The data collected only included bacteria.
The distribution here is clearly different from plots generated from SILVA: not only does the taxonomic classification not line up with the model’s interpretation, but several strong clusters appear which seem to have nothing at all to do with taxonomy. The reason for this is unclear until we consider the specific methods used during the sequencing of this data: students added multiple primer sets into the reagent mixture before sequencing, allowing the machine to target multiple parts of the 16S gene with short 300-length reads. The raw output from the Ion Torrent machine contains reads from all these different regions completely unclassified and mixed together. Ion Reporter handles variable region classification along with taxonomic classification and unique read filtering, which turned out to be another unexpected benefit of piggybacking off its output. Interestingly, it only outputs variable region classifications for about half of the unique reads; I had to make a separate small neural network to classify the remaining half using the provided labels as ground truth. Once I’d generated labels for my entire dataset, I was able to color in the plot I already generated by variable region.

And now we see the reason for the strange groups. The explanation of variable region makes sense: if sequences are being taken from different parts of 16S, those differences are going to be much larger than differences between different phyla of bacteria. There are still some unanswered questions here, such as why some variable regions appear in multiple tight clusters instead of a single cluster (maybe because of some other experimental error caused by the fact that the sequencing was done by high school students from a previous year?). But on the whole, this analysis method I’ve come up with has proven itself as a valuable data exploration strategy.
Looking to the Future
I recently did some further research into the current literature on this concept, and discovered that I wasn’t actually the first person to think of creating embeddings for DNA sequences in this way. There’s actually an entire field of machine learning known as metric learning, whose goal is to develop embeddings for data based on distance metrics. The most interesting and thorough paper I’ve seen is this one about what the authors call NeuroSeed, which is a very similar concept to what I’ve come up with (albeit with fancier math and a much deeper understanding of how the models behave and why).
So while what I have now likely isn’t publishable in its current state, I did learn a few important things through this process. First and foremost, ALWAYS READ THE LITERATURE FIRST. It’s dry and boring, but had I done a proper literature review right at the outset of this project, I could’ve avoided just reproducing advances that had already been made and instead created something truly original and scientifically valuable. Realizing that my “original idea” really isn’t original after all after two long years of development is probably the most painful way to learn the importance of starting with a literature review, but I have at least learned that lesson now.
That’s not to say this project was a total waste, though. Once I got past the initial disappointment, it was actually a really validating feeling to know that I’m barking up the right tree. The results that I was seeing are very similar to what some of the world’s foremost researchers working in large teams are achieving. And the reason I hadn’t heard of the existing research in this area until I really dug deep was because the area continues to be heavily under-researched. Based on the most current papers, I’ve already come up with plenty of ideas about how existing systems can be improved and applied to different use cases. And I know that if I were to spend another year or two building out one of those ideas, it’ll produce a more valuable result.
There’s a piece of writing advice that no words you write are ever wasted. Even if you end up deleting an entire paragraph of an essay or chapter of a book, you couldn’t have gotten to your final version without first iterating through the ideas that didn’t work out. That’s how I see the past years of my work here: not a failure and definitely not a success, but a stepping stone to something more meaningful in the future. Independently developing a system that’s already been out might not provide much value to the world, but it was critical to my personal development. Through this journey, I became more than fluent with Python, Jupyter, Linux, and the principles of distributed computing and multiprocessing. I started from zero knowledge of machine learning and data science and have gotten to a point where I can see myself producing work that’s valuable to the greater scientific community.
I’m currently in touch with faculty at UT and continuing to work on embedding generation for DNA sequences. I truly believe that more efficient sequence comparison and better data visualization have the potential to transform how we analyze genomic data, especially as the amount of data and amount of compute available increase exponentially. Fingers crossed, there’ll be an actual paper in the near future that offers a novel, well-researched contribution to the collection of scientific literature. But for now, I’m going to keep working.